Forex Candlestick and Pattern Trading contains the types of candlesticks based on their functions and benefits.
Candlestick patterns can be used to make market predictions based on the price action that occurs.
Chart analysis on the market to learn for the direction of market movements.
Using a combination of technical analysis and candlestick patterns with the help of various technical indicators.
Make trading more fun by understanding candlestick patterns and getting maximum profit.
Candlestick patterns can be used for stock, commodity, Forex and other markets
Learning candle patterns in groups from Forex Candlestick and Pattern Trading app is much like recognizing family members. If a large number of relatives were disbursed in a crowd of strangers it would be easy to miss them.
However, if the relatives were all brought forward and arranged by family units it would become rather easy to spot them, even if they were dispersed back into the crowd again.
Candlesticks, like relatives, can be grouped together and learned in family groups. They can be directly related or cousins. As in any family some of the cousins can be a bit odd, but in perspective they still fit and are much easier to remember if they can be placed into a family.
Candlestick patterns have very strict definitions, but there are many variations to the named patterns, and the Japanese did not give names to patterns that were 'really close'.
Experience and common sense allow traders to read the message even if it does not exactly match the picture or definition in the book.
Forex Candlesticks and Pattern Trading are graphical representations of price movements for a given period of time. They are commonly formed by the opening, high, low, and closing prices of a financial instrument.
If the opening price is above the closing price then a filled (normally red or black) candlestick is drawn.
If the closing price is above the opening price, then normally a green or a hollow candlestick (white with black outline) is shown.
The filled or hollow portion of the candle is known as the body or real body, and can be long, normal, or short depending on its proportion to the lines above or below it.
The lines above and below, known as shadows, tails, or wicks represent the high and low price ranges within a specified time period. However, not all candlesticks have shadows.

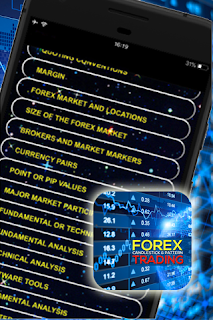
What will you get on the Forex Candlestick Patterns Trading;
- What is Forex Trading
- -Buying & Selling
- Quoting Convention
- Margin
- Forex Market and Locations
- Size of the Forex Market
- Brokers and Markets Makers
- Currency Pairs
- Point/Pip Values
- Major Market Participatnts
- Fundamental or Technical
- Fundamental Analysis
- Technical Analysis
- Software Tools
- Computer Requirements
- Deal Stations
- Japanese Candlesticks
- Repeatable Japanese Candlestick Pattern to Exploit
- Comparison between Candlestick and Bars
- Bearish Engulfing
- Bullish Engulfing
- Doji
- Dragonfly Doji (Bullish)
- Gravestone Doji (Bearish)
- Spinning Top
- Bullish Engulfing Pattern
- Bearish Engulfing Pattern
- Tweezer Bottom
- Tweezer Top
- Tweezer Mid
- Morning Star
- Afternoon Star
- Bullish Reversal Sign
- Evening Star
- Night Star
- Bearish Reversal Signal
- Hammer
- Bullish after a Significant Downturn
- Inverted Hammer
- Bullish at Bottom of Trend
- Shooting Star
- Bearish at Top of Trend
- Bullish and Bearish Rejection Pattern
- Chart Patterns
- Reversal Patterns
- Head and Shoulder
- Continuation Patterns
- Ascending and Descending Wedges
- Ascending Wedge in an uptrend-bearish
- Descending Wedge in a downtrend - bullish
- 123s Higher Lows and Lower Highs
- Double Tops and Double Bottoms
- Trendlines, Support & Resistance Lines
- Channels
- Continuation Patterns
- Rectangles - Bullish in an uptrend
- Rectangle - Bearish in a downtrend
- Ascending Triangles
- Descending Triangles
- Symmetrical Triangles
- Flags
- Bull Flag in an up trend - bullish
- Bear Flag in a down trend - bearish
- Pennants
- BUllish Pennant in an uptrend - bullish
- Bearish Pennant in a downtrend - bearish
- False Breaks
- False Breaks produce fast moves
- Retracement System
- Buy and Sell secret skills
- Piercing Line
- Three White Soldiers
- Hanging Man
- Dark Cloud Cover
A chart is primarily a graphical display of price information over time. Technical indicators and trendlines can be added to it in order to decide on entrance and exit points, and at what prices to place stops. All these charts inside can also be displayed on an arithmetic or logarithmic scale. The types of charts and the scale used depends on what information the technical analyst considers to be the most important, and which charts and which scale best shows that information.
If your interest is a qualitative view of the market, because you want to display data that have had a large percentage of increase or decrease in price, usually longer-term charts, then it is more appropriate to use a logarithmic chart. While the arithmetic shows price changes in time, the logarithmic displays the proportional change in price - very useful to observe market sentiment. You can know the percentage change of price over a period of time and compare it to past changes in price, in order to assess how bullish or bearish market participants feel.


Comments
Post a Comment